
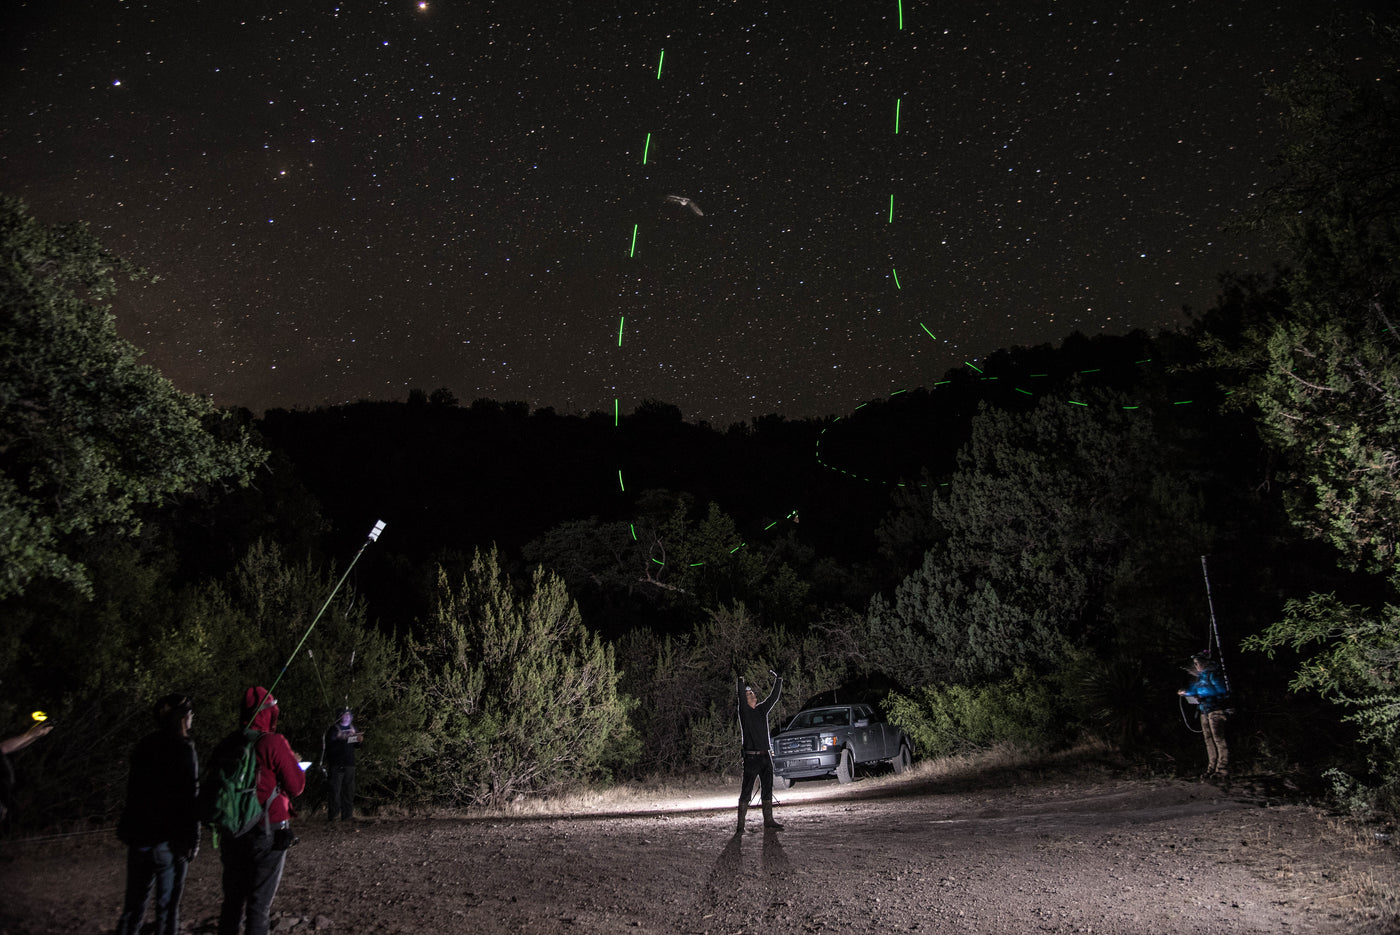
Photo: using a tiny LED, researchers temporarily track bats in an attempt to record reference calls which will then aid in refining the SonoBat bat call classifier engine.
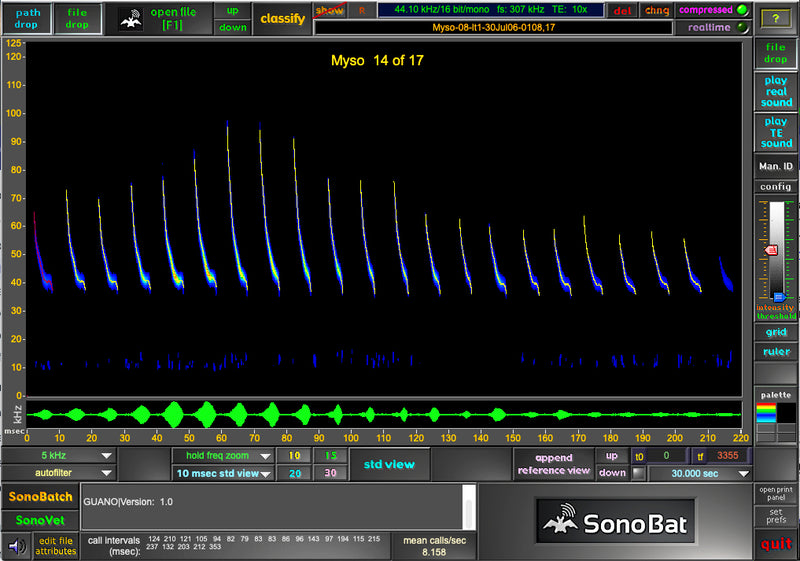
SonoBat software provides a comprehensive tool for analyzing and comparing high-resolution full-spectrum "sonograms" of bat echolocation calls recorded from full spectrum bat detectors. With its intuitive interface, SonoBat and SonoBatLIVE make it easy to record, process, display, and analyze calls with great sophistication.
SonoBat Software and Resources
SonoBat 4 North America

SonoBat 4 North America
$1,536.00
SonoBat software provides a comprehensive tool for analyzing and comparing high-resolution full-spectrum "sonograms" of bat echolocation calls recorded from full spectrum bat detectors. With its intuitive interface, SonoBat and SonoBatLIVE make it easy to record, process, display, and analyze calls with great sophistication. SonoBat is fully com...
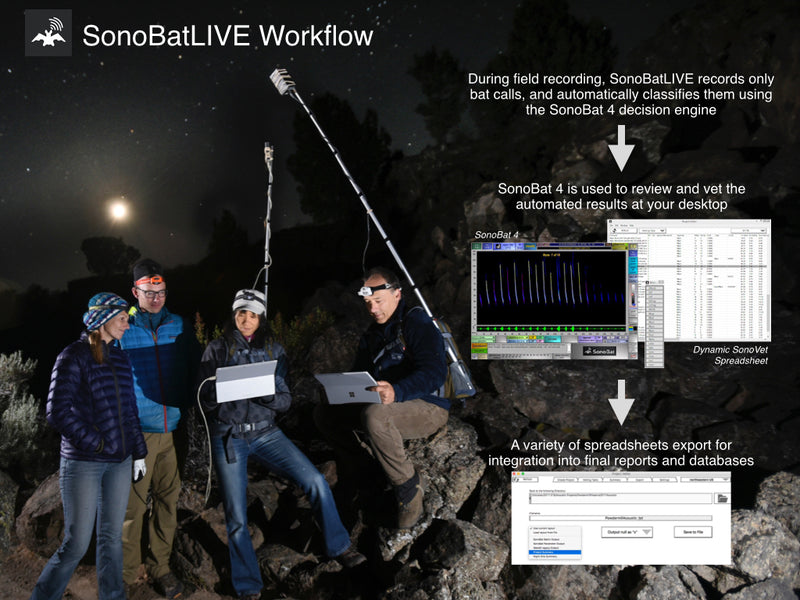
SonoBatLIVE

SonoBatLIVE
$0.00
The power of true full spectrum analysis, now literally in your hand. Only very recently the bat acoustic world has been turned on edge by a convergence of important developments in ultrasonic microphone design, powerful yet energy efficient tablets, and over 20 years of bat call study. SonoBatLIVE is the center of these intersecting paths and p...
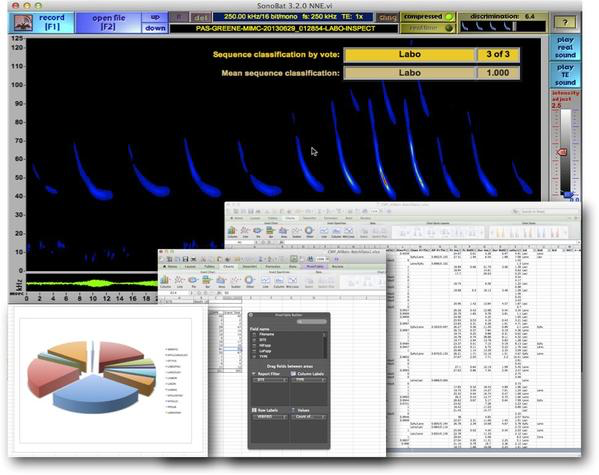
Bat Acoustic Data Post Processing and Manual Vetting

Bat Acoustic Data Post Processing and Manual Vetting
$295.00
See specific fees for Florida Bonneted bat data analysis here. See specific fees for Indiana and Northern Long-ear bat data analysis here. Several automated software programs have been developed to handle large acoustic data sets. And, the software developers would lead us to believe that their products will make echolocation call analysis fas...